The AIEL Monitor
The AIEL Monitor reports the evidence on artificial intelligence and work, internationally and for Sweden in depth. It is organised around four questions: which jobs are exposed, what employers demand, which firms adopt AI, and how employment and job quality are changing. A fifth module tracks the pace of the technology itself, which the other four are read against. Every indicator is dated and sourced, and built on public data so it can be cited and refreshed automatically.
AI-Econ Lab, since 2019 · Örebro University and Ratio · Örebro is a node of AISCAF, financed by WASP-HS
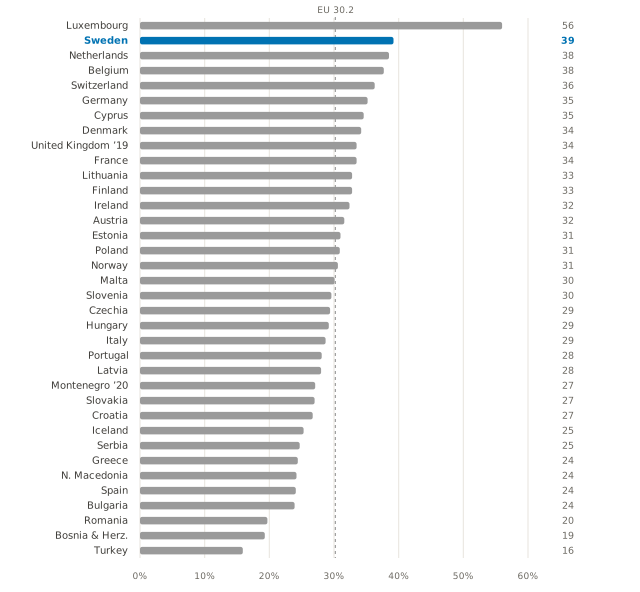
39% of Swedish jobs sit in the most AI-exposed quarter of occupations, among the highest of 36 countries (mean 30%). Exposure marks where AI overlaps with the work, not what follows from it.
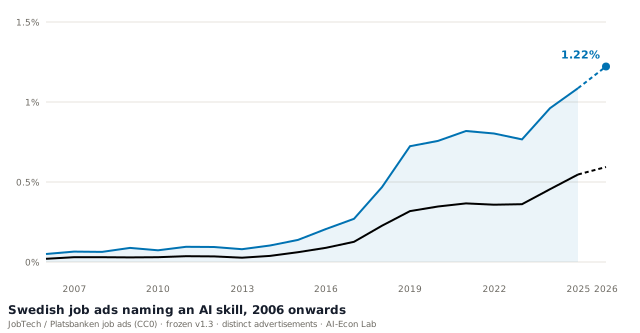
Ads naming a specific AI skill anywhere in the ad reached 1.06% in 2025, 38 times the pooled 2006–2008 level; the strict floor, ads asking for AI in the job's own requirements, reached 0.55%. Both set records in the post-2023 rebound, with generative-AI skills now 27% of the demand, and 2026 so far (January–June) runs higher still (1.20%, floor 0.60%, provisional).
The whole picture, in one glance
From what the technology can do to what happens to jobs and pay.
The four modules follow one chain. Exposure asks which jobs sit in AI's path; demand asks what employers are actually hiring for; adoption asks who is using AI in practice; outcomes asks what happens to employment, entry-level hiring and wages. A fifth band, Capability, tracks the technology itself: it measures what AI can do rather than the labour market, which is why it sits apart below the four. One international headline each, with Sweden as the depth cut inside every module. Every figure is public and dated; open a card to jump to the module.
the longest human-expert tasks frontier AI agents can finish about half the time; that length has been doubling every 4–6 months.
Module 1 · Exposure · which jobs sit in AI’s path
How much of each country's work is AI-exposed?
39% of Swedish jobs, about four in ten, sit in the most AI-exposed quarter of occupations, and exposure is not displacement: it marks where AI overlaps with the work, not what follows from it.
How exposure is measured, and what it says about displacement
DAIOE scores every occupation (ISCO-08) for how far generative AI overlaps with its tasks. We label the top 25% of occupations by that score the most AI-exposed; the bars show the share of each country's jobs in them (Eurostat EU-LFS employment, 2023; a few countries use their latest year, marked ’YY). On displacement: in the lab's own firm-level panel for Sweden, Denmark and Portugal, exposure shows no robust association with total firm employment, and within firms what it predicts is a shift away from clerical and administrative work rather than broad job loss (AI Unboxed and Jobs, linked below). Where movement has appeared so far, it is in who gets hired rather than in how many: the most exposed occupations hire fewer young workers (the Outcomes module below, and the Same Storm, Different Boats paper).
Sweden, in depth
39% of Swedish jobs are in the most AI-exposed occupations (the top 25% by generative-AI exposure), the 2nd-highest of 36 countries (mean 30%, seven of them outside the EU). The rank depends on where the line is drawn: Sweden is 2nd at this quarter cut and at a 30% cut, 3rd at a third, and 5th if only the top 20% of occupations count, so read it as among the most exposed rather than as a precise placing. The occupation-by-occupation detail lives on the DAIOE page, and Swedish employment is set against exposure over time in the Occupations Explorer below.
Module 2 · Demand · what employers ask for
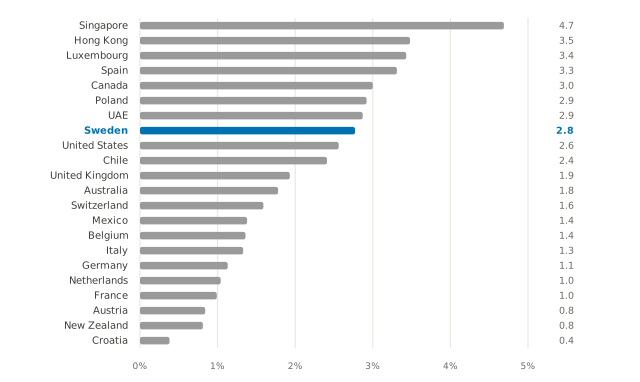
How much are employers hiring for AI?
The share of job postings that require AI skills, by country in 2025 (Stanford AI Index 2026 (Lightcast)), Sweden marked. Demand roughly doubled in a year for most countries (Sweden 1.3% in 2024 → 2.8% in 2025). This international series (Lightcast) is a separate source from the lab's own Swedish measure below, so their levels are not directly comparable.
Sweden, in depth · our live measure
How often Swedish employers ask for AI skills in their job ads, by year, by occupation, and soon by whether they want AI built, integrated, or simply used. We name the series by what the employer does, never by what the job is: ads that ask for AI skills, ads that name an AI skill. We deliberately avoid the phrase "AI jobs". We read every open and historical Swedish job ad (JobTech / Platsbanken, 2006 onwards) with a versioned, citable term list, so the level and its 38-fold rise from the pooled 2006–2008 base to 2025 are reproducible.
How the advertisements are read, and the two corrections since
Employers repost, so the archive holds 11.2 million records but 8.1 million distinct advertisements; we count each advertisement once. Two corrections since the first release both raised the rise rather than lowered it: repeat postings inflated the denominator, and a handful of early ads matched product names that did not yet exist.
This is demand written down in advertisements: whether the employer asks the person being hired to know or do AI, in the role's own requirements.
What this measures, and what it does not
It is not employment, which the outcomes module reports separately, and it is not AI use inside firms, which the adoption module reports. A rising line means employers ask for AI skills more often than they did; on its own it says nothing about whether AI created or removed any job. Not all hiring is advertised, so this is the advertised margin of demand rather than demand itself.
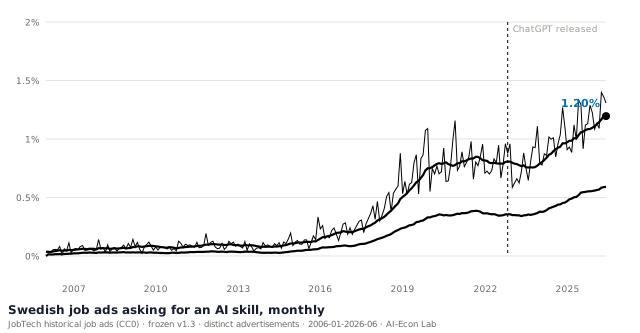
The same measure at monthly resolution, 246 months built on 8,056,733 distinct advertisements. The faint line is the raw month and the bold lines are 12-month trailing means: broad AI demand in blue, the narrower skill floor in orange. A single month carries little weight, because Swedish hiring falls sharply every July and again in December, so the trend is the line to read. On that basis the broad measure stands at 1.18% in June 2026, the latest month in the quarterly archive, against 0.60% for the floor; the live feed below tracks the weeks since.
The two lines differ in where we read. The lower line counts an ad only when AI is named in the job's own requirements, so ads that mention AI while describing the company are left out; the upper line counts a named AI skill anywhere in the ad, company description included. The gap between them is the reason we publish a range rather than a number.
This chart, like the whole Monitor, counts each distinct advertisement once. That matters for the 2022 to 2023 dip: Swedish employers, mostly staffing, care and door-to-door sales agencies, repost the same advertisement many times, and that practice grew sharply and then receded. Counted this way the share drifts 7% from 2021 to 2023, against the 30% collapse a raw record count shows. The rise since 2024 survives either way.
Where the dip goes when you count each advertisement once
Repeat postings are 13% of all records in 2008, 33% in 2021, 49% in 2023 and 29% in 2025. Because AI ads are repeated at about half that rate, the denominator swells faster than the numerator exactly when the dip appears. On distinct advertisements the share runs 0.81% in 2021, 0.78% in 2022 and 0.75% in 2023; the raw-record series is kept alongside as the robustness line. Total advertisement volume also fell over the same period as hiring cooled with the rate rises that began in April 2022 (the downturn our Same Storm, Different Boats paper works with), so the denominator moves with the cycle as well.
Of the 39,836 most recent job ads, 1.41% name a specific AI skill and 0.80% ask for one in the job itself (95% intervals 1.29–1.53 and 0.72–0.89). These numbers run a little higher than the chart's, for two reasons we have measured: the live feed carries a somewhat different mix of ads than the yearly archives, and the archives store slightly shortened ad texts. Once we can calibrate the two against each other, they will join into one line that runs to today. A rolling window also moves with the season, so compare it with the same weeks a year earlier rather than with last month; August is the low point in every year we can measure (0.64% in 2023, 0.84% in 2024 and 0.90% in 2025 on the whole-text measure), and September recovers each time.
The national figure is an average over a very uneven distribution. In the occupations where AI demand concentrates, one advertisement in seven asks for it; in several of Sweden's largest occupations, essentially none do.
Occupations with at least 400 advertisements in 2025. Names are our English renderings of the employment service's Swedish occupational labels. The measure is the strict floor, so an occupation reads zero when no advertisement asks for AI skills in the role itself, not when the word AI never appears. The line marks the national figure, 0.55%.
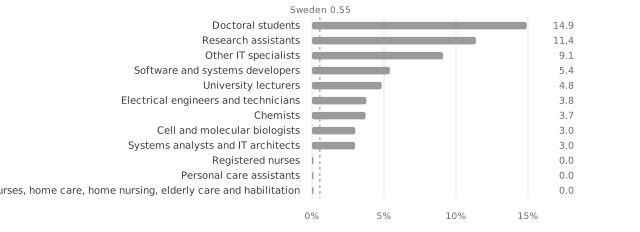
The split between building AI, putting it in place and simply using it is not a national constant. It is an occupational structure, and it separates research and software roles from the professions where AI arrives as a tool.
| Occupation | AI ads | Builds | Integrates | Uses |
|---|---|---|---|---|
| Software and systems developers | 756 | 46% | 26% | 4% |
| Doctoral students | 230 | 80% | 10% | 0% |
| Research assistants | 130 | 68% | 17% | 2% |
| Other IT specialists | 118 | 63% | 25% | 1% |
| Electrical engineers and technicians | 115 | 48% | 22% | 2% |
| Systems analysts and IT architects | 96 | 55% | 31% | 1% |
| University lecturers | 46 | 72% | 11% | 0% |
| Electrical engineers (graduate) | 34 | 32% | 18% | 0% |
| Mechanical engineers | 33 | 48% | 21% | 0% |
| Medical secretaries etc. | 30 | 0% | 0% | 0% |
Occupations with at least 25 distinct AI-skill advertisements in 2025; repeat postings of the same advertisement are counted once. Rows do not sum to 100: the remainder is advertisements the classifier places in the AI-literacy grey zone or judges not to be AI demand at all, which is how medical secretaries appear at zero on all three tiers despite passing the lexical measure. 88.9% agreement with hand-labelled ads on the four-way split, 93.8% on the grouping shown.
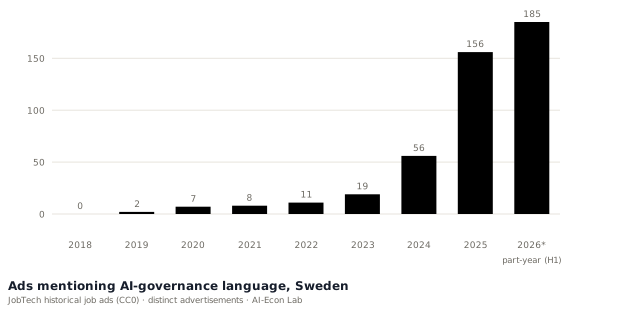
A separate band counts ads that mention the vocabulary of AI governance: responsible AI, AI ethics, AI safety, AI governance and the AI Act. It has been computed since the series began and never shown. There were none in 2018 and 156 in the whole of 2025; the first half of 2026 alone has 185, which is 6.3% of all AI ads against 3.5% across 2025 as a whole: the share has nearly doubled in half a year.
Read this as language, not as jobs. Unlike our headline series, this band counts any mention rather than a requirement of the role, and a hand-check of every ad in the 2026 band found that 95% mention governance only in passing, usually an employer’s boilerplate about building responsible AI in posts for engineers, project managers and designers. What is rising fast is how often the language of AI regulation appears in Swedish hiring copy, which is worth knowing. It is not a count of governance jobs, and we do not have one.
What the hand-check of all 199 ads found
Only ten of those ads name governance in the headline. The hand-check read the 199 RECORDS in the band; the chart plots the 185 distinct advertisements they reduce to, a difference of 14 repeat postings. The hand-check called 33 of the 199 repeats, which is more than the deduplication finds, because it recognised as the same posting some advertisements that differ in headline, employer name or opening text — the fields the dedup key uses. The published figure is therefore the conservative one.
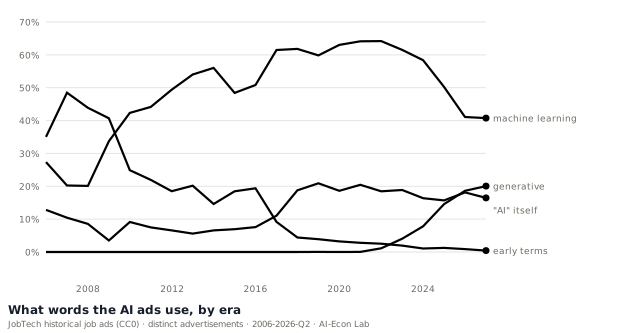
The standing objection to any long AI series is that today’s vocabulary is being read into yesterday’s ads. The ads answer it. In 2006 the words were 21% data mining, expert systems and their kin, terms almost nobody advertises for now (0.6% in the latest period). Machine-learning vocabulary took over from about 2016, and the generative vocabulary is absent before 2022 and is 36% of all term matches today. The list is not anachronistic; the language turned over, and the measure follows it.
Shares of 58,823 term matches, in five families that between them account for every match. For display, product names and words with an older everyday sense are counted only from the year they acquired their AI meaning, so the chart does not show a 2006 ad matching a model released in 2023; the published series is frozen and unchanged.
Where the demand sits, in the employers' own words. The same titles head the list year after year: machine learning engineer, data scientist, AI/ML developer. One entry is a measurement artefact worth naming: medical secretary (medicinsk sekreterare) appears because those ads mention speech-recognition software, and our classifier judges almost all of them to be describing a tool the job uses rather than an AI skill it asks for. The newcomers column is the language at work: job titles crossing three ads in a year for the first time.
2026 · H1
Machine learning engineer · Data scientist
2025
AI/ML-utvecklare (AI/ML developer) · Machine learning engineer
2024
Machine learning engineer · Data scientist
New titles in AI demand
AI ambassador (2023), AI content producer (2023), AI-experter / AI experts (2024), AI lead (2025), AI data annotation specialist (2025), Senior agentic AI developer (2026)
Cooled: no longer clear the bar
Telemarketer (2018), Construction engineer (2022), Mathematical statistician (2023), Inside sales (2024), Network technician (2024)
Top titles and the newcomer list are the advertisements' own headlines, as employers wrote them (lightly cleaned: employer and place names removed), with an English gloss where the employer wrote in Swedish; top titles are counted among ads that ask for AI skills in the role itself, and a newcomer's year is the first in which at least three ads carry that title. The cooled list still uses the employment service's occupation taxonomy (our English renderings), where an occupation "clears the bar" with at least five AI-skill ads in a year. A vacancy posted more than once counts each time.
Every ad that asks for AI skills in the role itself, 2023 to mid-2026, classified by what the worker is hired to do with AI. A language-model classifier applies the lab's written labelling rules; it agrees with our hand-labelled reference ads 88 per cent of the time on the four-way split and 91 per cent on the grouping shown here. The headline: employers still mostly hire people to build AI, but the fastest-growing tier is people hired to simply use it.
Builders
Create AI: ML engineers, data scientists, applied-ML research. Half of strict AI-skill ads and steady: 46% in 2023, 51% in the first half of 2026.
Integrators
Wire AI in and shape its adoption: architects, MLOps, adoption champions. Growing: 17% in 2023, 23% in the first half of 2026.
Users
Use AI as a tool of an otherwise non-AI job: admin, marketing, care, teaching. Small but rising fastest: 1% in 2023, 9% in the first half of 2026, and climbing quarter on quarter.
Module 3 · Adoption · who is actually using it
How widely has AI actually been adopted?
Exposure is potential; adoption is what firms have done. Adoption is climbing fast: the EU average rose from 8% in 2023 to 19.9% in 2025, and exposure and adoption need not line up across countries.
Three levels, three denominators
Three levels, three denominators. Firms adopt, workers use AI at work, and the population uses it at all. Each is measured on a different population, so the three are never set side by side here. Firms come first below, then workers, then the population. The weakest of the three is the worker level: Sweden has no representative public statistic for the share of employed people who use AI at work, so what we can show is a professional-union panel, labelled as such.
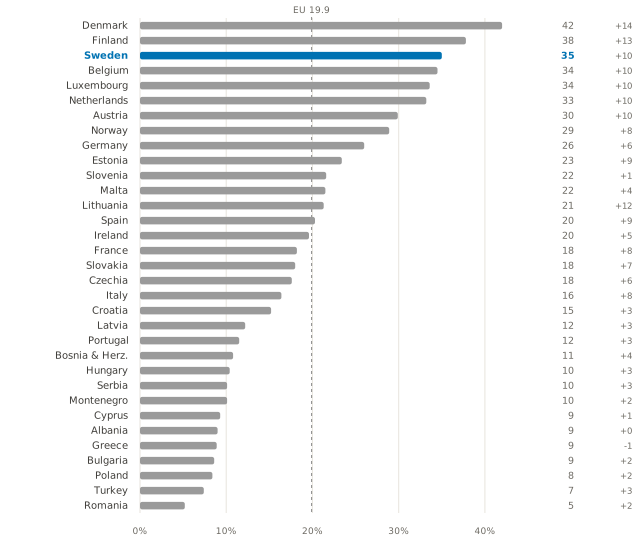
The bars are the share of enterprises using at least one AI technology, with the year-on-year change since 2024 shown as +pp.
Sweden, in depth · by firm size
Sweden is among the EU leaders at 35% in 2025, and adoption climbs steeply with the size of the firm, from 31% of small firms to 72% of large ones. The headline (35%) is a figure for firms with ten or more employees, and among the smallest firms adoption is roughly half that, which is worth knowing before it is read as a national rate.
Why the headline stops at ten employees
Eurostat's population stops at ten employees and it publishes no EU figure for anything smaller. SCB surveys firms from no employees upward, so the three rows below the headline are ones almost no other country can show: Sweden was one of two countries reporting the 0–9 class to Eurostat for 2025.
The highlighted row is the same number the cross-country bar above shows. Every class is up sharply since 2021.

The Nordics, in depth · by firm size
This is the one depth cut that goes Nordic, because Eurostat publishes the size classes for every country and back to 2021. Sweden is third of the four and grew fastest, from 9.9% to 35.0% among firms with ten or more employees, against Denmark's rise from 23.9% to 42.0%. Growing fastest and still behind is the pattern to read here, and it holds in every size class.
Why four countries, and why size and not industry
Iceland has no row in Eurostat's AI table, though it is in the exposure module above. A country missing from a source is missing, so it is absent here rather than shown as a gap.
Adoption by industry cannot go Nordic. Eurostat publishes a single all-activities NACE aggregate; the industry cut on this site comes from SCB's national release. There is no Nordic equivalent unless DST, SSB and Tilastokeskus each publish their own.
The axis is shared across the four panels, so the countries stay comparable; the highlighted row in each is that country's 10+ headline, the same figure the cross-country bar above shows.
Sweden, in depth · by worker
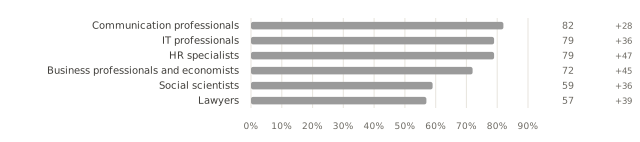
Firm surveys count employers who have started; this counts people. The share of professionals using AI daily or weekly went from 28% in May 2024 to 68% in May 2026, and the spread by profession is wide: communication professionals are furthest ahead and lawyers furthest behind.
Which rounds compare like with like
The two rounds quoted are the only two that asked the question the same way, and it is Akavia's own threshold. Counting any use at all, however occasional, gives 89% on the same round. Nearly everyone now works somewhere AI is used at all (92% in 2024, 97% in 2025). Central government trails the private sector by 33pp. Men 72%, women 65%.
Bars are May 2026, with the change measured against May 2024, the one earlier round that asked the question identically. Cell sizes differ a great deal: communication professionals rest on 80 respondents (71–93% interval), against 1202 for the largest group.
The Swedish number above is one professional union's members; no representative Swedish figure exists at this level. The nearest comparison is American: 37.8% of employed adults used generative AI for work in the reference week (Real-Time Population Survey, Q1 2026), a whole-workforce rate. Sweden publishes no equivalent: the national survey asks about work-related use but counts it across the whole population rather than the employed. That gap is the reason this level is the module's weakest, and a thing worth measuring rather than citing. Measures recognised, deliberate use: respondents who had never heard of generative AI are routed past the survey module and counted as non-users.
Data shared with the lab by Akavia. Figures describe Akavia's members in six professions, not the Swedish labour market as a whole, and the sample is not an unrestricted random sample of the population. The question wording also changed three times over the period, so the trend is not a clean time series: part of any change reflects the wording rather than behaviour, and the size of that part is not knowable from these data.
About the Akavia panel
Akavia surveys its members through a web panel covering business professionals and economists, lawyers, IT professionals, social scientists, HR specialists and communication professionals. Between about 3,000 and 3,800 members answer each round, with response rates from a quarter to just under a half. On wording: the 2023 rounds asked how often members used AI tools (AI- verktyg), 2024 asked how often they actively used any form of AI, and 2025 dropped the word actively; 2026 returned to the 2024 wording. The response scale is identical throughout, so only May 2023 against September 2023, and May 2024 against May 2026, compare like with like. The headline counts regular use, meaning daily or weekly, which is the threshold Akavia use in their own published reporting, and it counts everyone in the base including those who answer that they do not know. Counting use at any frequency instead gives a higher series, shown alongside it.
Sweden, in depth · the same people, twice
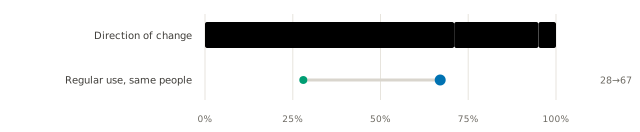
A rising level can mean new users arriving or existing users using AI more, and the rounds above cannot tell them apart. Following the same 1,161 respondents from May 2024 to May 2026 can: of those who used AI never in the first round, 77% had started by the second, while only 4% of the earlier users had stopped. The traffic is almost all one way.
Which rounds can be followed, and who is in the base
These are linked respondents who answered the question in both rounds, weighted on the later wave's weight. Two rounds out of six can be compared this way: the rest ask the question differently, and a change measured across a rewrite is the rewrite. Following people means following the ones who answered twice, so the base is smaller than a round and not identical to it: regular use among them was 26% at the start against 30% in the full round, and 67% against 69% at the end. Close, but the gap is real and the numbers here are not adjusted for it.
Bars are everyone who answered in both rounds (1,161 people). The two subgroup figures rest on smaller bases: 499 who reported never using AI in the first round, 662 who reported using it.
Sweden, in depth · by person
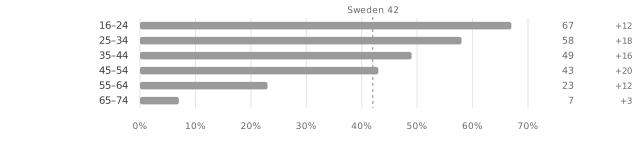
The share of everyone aged 16–74 who has used generative AI at all rose from 28% in 2024 to 42% in 2025 (±2), and age divides it far more than anything else: 67% of 16–24-year-olds against 7% of 65–74s, a 60-point span.
What the population survey covers, and how firm it is
Broadest of the three levels: at work or outside it, from SCB's population survey, a probability sample with published margins of error, which makes it the firmest number in the module. The gap between men and women is narrowing, from 10 points in 2024 to 7 (45% against 38%). Figures refer to the first quarter of the survey year.
The US counterpart at this level is 57.9% (Real-Time Population Survey, Q1 2026), which is a reference point rather than a ranking.
Why this is a reference point and not a ranking
It covers ages 18–64 where SCB covers 16–74, and Swedish 65–74-year-olds use generative AI far less (7%), which pulls the Swedish figure down relative to a US-style base.
Module 4 · Outcomes · what happens to jobs and pay
What does it mean for jobs and job quality?
Exposure and demand are inputs; outcomes are what happens to workers. Three views: employment by occupation, working conditions, and the entry-level "canaries" signal on vacancies.
Swedish employment by occupation over time (and, soon, by region), with DAIOE AI-exposure overlaid. Built and maintained in-house; yearly and monthly views.
Yearly Swedish employment by occupation group, with DAIOE AI-exposure levels overlaid.
Monthly Swedish employment by occupation group, with DAIOE AI-exposure levels overlaid.
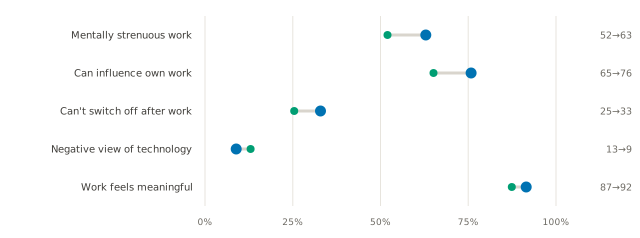
More AI-exposed occupations are the classic "active job": more mentally demanding, but with more control over one's work; harder to switch off after hours, yet more meaningful and markedly more positive about technology. Public survey data by occupation, set against DAIOE generative-AI (v2023); descriptive, not causal, and a single cross-section: more-exposed work is also more qualified work, so part of every gap here is occupational composition rather than anything AI does.
Toggle gender: the control gap narrows as exposure rises. In low-exposure jobs women report far less influence than men (56% vs 68%); in high-exposure jobs it nearly closes (74% vs 78%).
Among Swedish professional-union members, workplace governance runs well behind actual use. In May 2025, 77% used AI at work while only 50% knew of a policy and 38% of a strategy, a gap of 27pp. The figures say knows of rather than has: about a fifth answer that they do not know, which is counted here as not knowing of one. Training runs the same way: 90% want to develop their AI skills, 33% have been offered it by an employer, against 82% and 6% in 2023.
| Wave | Uses AI | Knows of a policy | Knows of a strategy |
|---|---|---|---|
| May 2023 | 32% | 12% | 11% |
| Sep 2023 | 43% | 18% | 15% |
| May 2024 | 61% | 30% | 23%† |
| May 2025 | 77% | 50% | 38% |
† From May 2024 the strategy question changed: it dropped its "other" option and asked about the respondent's workplace rather than their whole organisation. Both changes tend to raise the share answering yes, so the May 2024 and May 2025 figures are not continuous with the two above them.
The same people, on governance
Of the 920 members who did not know of an AI policy at their workplace in May 2024, 60% knew of one by May 2026 (56–64%). Of the 368 who did know, 9% no longer did (6–13%). Across all 1,288 who answered in both rounds the share went 29% to 69%.
What this counts, and who is in the base
These count knowing of a policy, not employers having one: a member who answers that they do not know is counted as not knowing of one, so a move from no to yes is a member who came to know, which can mean their employer introduced a policy, that they changed employer, or that they found out about one that already existed. The reverse move can equally mean a job change or a policy nobody has mentioned since. Linked respondents who answered in both rounds, weighted on the later wave's weight. This base tracks the rounds it comes from closely: 30% against 30% at the start and 69% against 67% at the end.
What the work actually is, among AI users:
- 77% information handling
- 76% language and phrasing
- 18% creative content
- 15% administration and support
- 10% service and product development
And who provides the tools: 50% have a private e-mail account connected to a work AI tool, the employer pays for 33% and 15% pay themselves.
Who these percentages are of
Those shares are among workers using standalone AI tools, not among all workers, so they describe a subset and not the workforce.
Data shared with the lab by Akavia. Figures describe Akavia's members in six professions, not the Swedish labour market as a whole, and the sample is not an unrestricted random sample of the population. The question wording also changed three times over the period, so the trend is not a clean time series: part of any change reflects the wording rather than behaviour, and the size of that part is not knowable from these data.
About the Akavia panel
Akavia surveys its members through a web panel covering business professionals and economists, lawyers, IT professionals, social scientists, HR specialists and communication professionals. Between about 3,000 and 3,800 members answer each round, with response rates from a quarter to just under a half. On wording: the 2023 rounds asked how often members used AI tools (AI- verktyg), 2024 asked how often they actively used any form of AI, and 2025 dropped the word actively; 2026 returned to the 2024 wording. The response scale is identical throughout, so only May 2023 against September 2023, and May 2024 against May 2026, compare like with like. The headline counts regular use, meaning daily or weekly, which is the threshold Akavia use in their own published reporting, and it counts everyone in the base including those who answer that they do not know. Counting use at any frequency instead gives a higher series, shown alongside it.
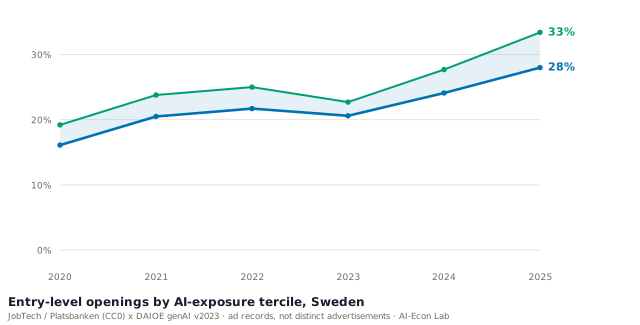
In the most AI-exposed occupations, a smaller share of openings ask for no prior experience than in the least-exposed occupations, every year since 2020, and the gap has widened from −3.1pp to −5.3pp in 2025. This is consistent with the canaries finding of our Same Storm, Different Boats study (the most AI-exposed occupations hire fewer young workers, the labour market's canaries in the coal mine), but it is not independent evidence for it, and this module counts ad records rather than distinct advertisements.
How this is counted, and what it cannot show
Entry-level hiring is more cyclical than experienced hiring, the tightening cycle that began in April 2022 fell hardest on exactly these occupations, and this series starts in 2020 with no pre-pandemic baseline, so it cannot separate AI from the cycle. It counts records because it reads totals from the JobTech API, which cannot be deduplicated; elsewhere on this page, counting records rather than advertisements manufactured an artefact of about thirty points. The Same Storm paper can separate them, because it observes employers and workers’ ages and identifies within employers. Descriptive throughout: less-exposed work also skews lower-skill, so part of the level gap is structural. The same entry-level pattern appears in the international AI "canaries" literature on young workers, though no directly comparable cross-country series exists yet.
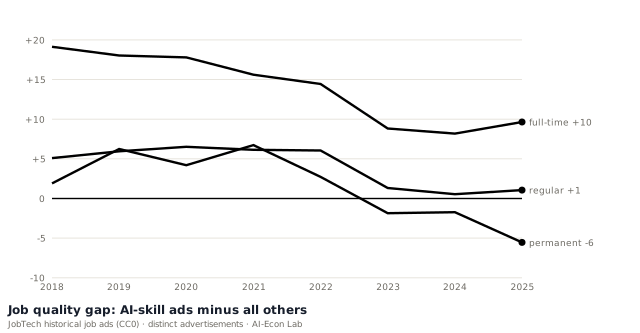
Job ads carry structured fields describing the post itself, so we can ask whether a vacancy that requires an AI skill offers better terms than everything else advertised the same year. The chart shows the gap in percentage points, AI-skill ads minus all other ads, on three measures.
AI-skill posts have always been more often full-time, but the advantage is closing: +19pp in 2018 against +10pp in 2025. On permanent contracts the advantage has not merely narrowed, it has reversed: AI-skill ads were +2pp more often open-ended in 2018, and -6pp less often by 2025. Read this as description, not as a finding about what AI does to job quality: composition alone could produce the whole reversal, and nothing here holds occupation fixed.
Why composition could explain this, and what it survives
The series crossed zero in 2023. It does not compare like with like, because AI-skill ads sit in different occupations from the average vacancy and AI demand has been spreading out of a specialist niche into ordinary hiring over exactly this period. What the series does survive is deduplication: counting each advertisement once rather than once per posting moves every gap by under 2pp, so it is not an artefact of employers reposting.
Over the past decade the most AI-exposed occupations have NOT pulled away in pay.
How the thirds are cut, and the country detail
In the United States their real median wage grew 3.6 per cent against 10.2 per cent for the least exposed (2015 to 2025), a gap of -6.6 percentage points the other way. In Sweden real wages are close to flat in all three groups over 2014 to 2025 (most exposed +0.9 per cent, middle +1.1, least -0.8). Read the post-2022 turn with care: that window also covers the tightening cycle, which fell hardest on the same professional and technical occupations, so its timing does not identify a cause. AI-exposed occupations remain the best paid in level terms in both countries. Pay as an outcome: are wages in AI-exposed occupations pulling away, or falling behind? Occupations are split into thirds by their DAIOE generative-AI exposure; each line tracks the group's median wage in REAL terms, indexed to 100 in the first year. Read the gap between lines, not the level.
Sweden · median monthly salary
SCB wage structure statistics (lönestrukturstatistik), SSYK 2012 4-digit, all sectors, 2014–2025; 314 occupations, employment-weighted (Yrkesregistret 2023)
United States · median annual wage
BLS OEWS national, detailed SOC, May 2015–May 2025; 692 occupations, employment-weighted
EU27 (coarse, ISCO 1-digit, Structure of Earnings Survey): mean hourly earnings grew 14.2 per cent in the most exposed third against 16.8 per cent in the least, 2018 to 2022. A finer country-level series is the planned upgrade.
- Real wages, deflated with SCB KPI (2020=100), calendar-year mean, for Sweden; FRED CPI-U (NSA) at each May, matched to the OEWS reference month, for the United States; Eurostat HICP annual average for the EU27 line. Deflation leaves the pay RATIO between groups exactly unchanged, so it cannot manufacture the result; it does change a difference of growth rates, which is why the figures above are the real ones.
- Exposure is DAIOE generative-AI (v2023), fixed over time: the lines answer how pay moved in occupations that are exposed today.
- Both countries are employment-weighted, with weights held fixed (Sweden: Yrkesregistret 2023) so the index reads as wage growth rather than employment reallocation between occupations.
- Descriptive, not causal: composition, sector and skill mix all move wages too.

Module 5 · Capability · what the technology can do ◔ External series · checked 21 Sep 2026 · two figures awaiting a source update
How fast is the technology itself moving?
Everything above measures AI in the labour market; this small module tracks the technology itself, in the most work-relevant unit there is: how much human working time a single AI run can replace. The frontier is jagged, and it moves fast: on novel interactive worlds, where the goal must be inferred without instructions, the best system scored under 1% at the benchmark's launch, 30% of human level in July 2026 and 63% in September, and 99.9% when the same September model is allowed the context management its own provider designed for it. That benchmark is scored against people by construction: every environment is verified solvable by a human, and 100% means matching human efficiency, so the figure is a distance to human performance rather than a head-to-head result. Frontier capability is also what our DAIOE exposure measure tracks on the technology side.
Sources: METR time horizons · Epoch AI trends · Stanford AI Index · ARC Prize. These are external research series, quoted with their dates; we summarise, we do not produce them. Figures refresh with the sources' own releases. The compute trend is recomputed here from Epoch's public model table on every refresh; the METR figures are checked against the source's own published measurements on every refresh and read by hand when they move; the ARC-AGI figure is read by hand when its source moves. Each tile carries its own date.
The whole picture on one page. A dated infographic with all five modules, generated from this page's own data: download the two-page sheet (PDF), or the Swedish edition. The figures on it come from different years and survey waves, so each states its own year.
Method · sources, versions and limits
What we measure, and what we don't yet.
The measure runs on public data with one exception, described below. The Swedish demand series reads every open and historical advertisement in Sweden's public job board (Platsbanken), 2006 onwards. An ad counts when its text names an AI skill; the stricter floor counts it only when the skill sits in the role's own tasks or requirements. The term list behind the measure is versioned and kept current against new AI vocabulary, and every chart states which version produced it. Every figure here can be downloaded as data, and the advertisements behind the Swedish series are public and openly licensed, so the series can be rebuilt from source. The methods page documents the estimand, the lexicon layer by layer with its published sources, the full version history with fingerprints, and the validation figures for each freeze; it also states plainly what is not yet published. Exposure, adoption and cross-country demand come from DAIOE, Eurostat and the Stanford AI Index.
The exception is the worker-side layer, which comes from Akavia, a Swedish professional union that surveys its members through a web panel and shares the de-identified results with the lab. We publish aggregated figures with attribution and keep the underlying records private; cells below 50 respondents are never shown. Akavia does not fund the lab and does not see results before publication. The processing, and any error in it, is ours.
Nordic coverage, as of September 2026
The country charts highlight the Nordics, and how far the Nordic frame reaches differs by module, so the state is set out here rather than implied. Exposure covers all five: Sweden, Denmark, Norway, Finland and Iceland. Adoption and the firm-size cut cover four; Iceland has no row in Eurostat's AI table. Adoption by industry is Sweden only, because Eurostat publishes a single all-activities aggregate and the industry breakdown comes from SCB's national release. Demand, from job advertisements, and the entry-level outcomes from the registers are Sweden only, as is the worker survey. Danish and Norwegian advertisement sources are under assessment; a second country enters the demand series only when its coverage has been measured, not when access has been arranged.
Caveats, in plain sight
- 2026 is partial: the first half comes from the Q1–Q2 archives and the latest weeks from the live feed; the newest point will revise.
- The chart ends with the June archives; the live feed runs to today and joins the chart once the two sources are reconciled.
- The 2022–2023 dip is mostly an artefact of reposting. Repeat postings ran 33% of records in 2021 and 49% in 2023, and AI ads repeat at about half that rate, so the denominator swelled faster than the numerator exactly when the dip appears. Counting each advertisement once, the share drifts 7% from 2021 to 2023 against the 30% fall the raw series shows. A real slowdown remains; a collapse does not.
- The upper bound is now measured across the whole series, not just 2025. Counting every ad that mentions AI in any form gives 2.45% for 2025, but that band is mostly company boilerplate. We read 230 advertisements from it by hand, spread over four periods — 2006–2013, 2019, 2022 and 2025 — and 32 are genuinely AI roles. The four periods are statistically indistinguishable, so a single correction applies throughout rather than a different one per year. Re-derived on the v1.4 band it is 12.8% (95% interval 8.9–18.1), and v1.5 leaves the bare-AI band unchanged to the advertisement, so that derivation carries over, which puts the corrected 2025 ceiling at 1.24% (1.19–1.31), not 2.45%, and the published 2025 range at 0.55% (floor) to 1.24% (ceiling).
- The ceiling bounds AI demand we can detect from words, not AI demand. Both lines are anchored to a term list, so an ad that is genuinely an AI job and never uses an AI word is in neither, and nothing on this page bounds it. That residual is not yet measured; an audit of the ads the term list never flags is the next piece of work. Its direction is known and it is upward.
- Ads that mention AI only when describing the company never count towards the floor; the floor counts an ad for what it asks of the person being hired. The broader line does count them, which is precisely why the two differ.
- Counts are distinct advertisements: employers repost, so the archive holds 11.2 million records but 8.1 million distinct advertisements, and each is counted once. The raw-record series is retained alongside as the robustness line. Two modules still count records and say so where they appear: the entry-level squeeze, which reads totals from an API that cannot be deduplicated, and the employers' own wording block, where a vacancy posted more than once counts each time.
- The builder / integrator / user split is classifier-based (validated against hand-labelled ads at 88% on the four-way split); a small share of ads sits in an AI-literacy grey zone outside the three tiers, and a reconciliation of the classifier's strictness against our hand-labelled benchmark is in progress. Shares may move a little; the ranking and trends are robust.
How to cite
The monitor is a citable public good. Please cite the specific version and date, and the underlying source shown in each figure's footer (for example DAIOE generative-AI v2023, or Eurostat 2025).
AI-Econ Lab (2026). AIEL Monitor: [module]. Örebro University and Ratio. [source and version from the figure footer]. Accessed [date], https://ai-econlab.com/monitor/
Research cluster and funder


AI-Econ Lab, since 2019 · Örebro University and Ratio. Örebro is one of AISCAF's three nodes; the cluster, financed by WASP-HS, funds part of the lab's team.